vue引入echarts图表根据接口请求获取数据
下载echarts
npm i echarts -S
main.js引入echarts
Vue.use(echarts);
Vue.prototype.$echarts = echarts;
1.html 命名id 在带有id的盒子上进行绘制图表
      <div class="echarts_box">
        <div id="tradingIndex" class="canvans"></div>
      </div>
2.css 设置绘制图表盒子的宽高
.echarts_box {
  width: 95%;
  height: 550px;
}
.canvans {
  width: 100%;
  height: 550px;
}
3.js
	//
	mounted() {
		//调用接口函数
    	this.getData();
  	},
	//请求接口
    getData() {
      this.$axios({
        url: "/***/****/****",
        method: "post",
      }).then((res) => {
        console.log(res);
        if (res.data.status == 1) {
          let arr = res.data.data;
          arr.forEach((item) => { //处理数据
            this.LineDataX.push(item.show_date);
            this.LineDataY.push(parseInt(item.total_money / item.total_num));
          });
          //再调用图标函数
          this.$nextTick(() => {
            this.getStatisticalLine();
          });
        }
      });
    },
    // 绘制折线图
    getStatisticalLine() {
      let chart = this.$echarts.init(document.getElementById("tradingIndex")); //引用带有id的标签
      let option = {  //图表的样式
        tooltip: {
          trigger: "axis",
        },
        xAxis: {
          type: "category",
          data: this.LineDataX,
        },
        yAxis: {
          type: "value",
          name: "交易指数(金额/数量)",
        },
        series: [
          {
            data: this.LineDataY,
            type: "line",
          },
        ],
      };
      chart.setOption(option); //绘制 必须要有
      window.addEventListener("resize", () => {  //根据屏幕进行实时绘制
        chart.resize();
      });
    },
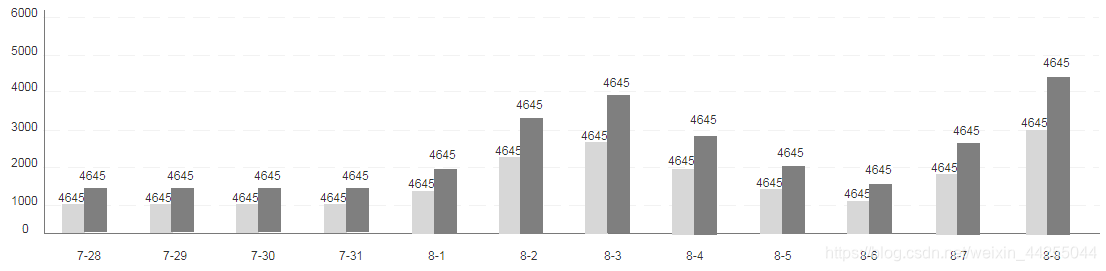
4,展示样式
5.这个网站有很多echarts的模板基本可以实现项目中的一些图表
网址:
https://www.makeapie.com/explore.html#charts=bar
components=grid
sort=rank
timeframe=all
author=all
希望大家多多支持
版权声明:本文为weixin_44255044原创文章,遵循 CC 4.0 BY-SA 版权协议,转载请附上原文出处链接和本声明。