首先,使用sklearn中自带的数据集创建一个DataFrame:
import pandas as pd
from sklearn.datasets import load_iris
x=load_iris().data
x=pd.DataFrame(x,columns=load_iris().feature_names)
y=load_iris().target
y=pd.DataFrame(y)
df=pd.concat([x,y],axis=1)
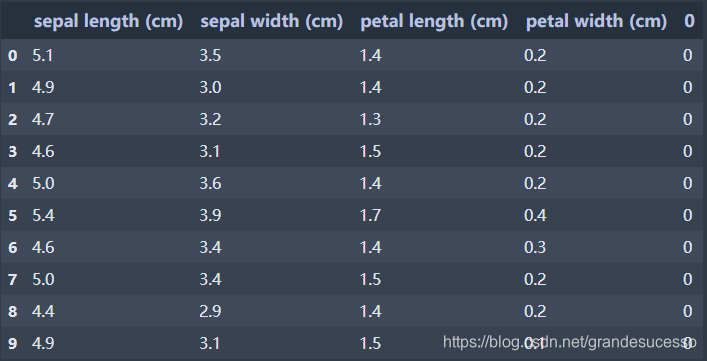
df.head(10)
生成DataFrame如下:
‘DataFrame.style.applymap’函数美化满足条件的值
‘applymap’函数是针对DataFrame中满足条件的每个值进行美化的。
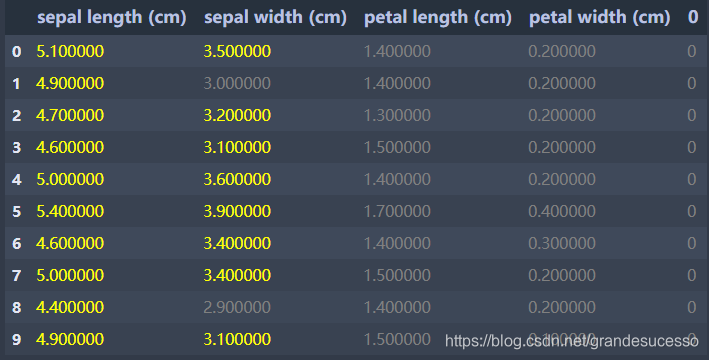
# 首先自定义一个函数:大于3的数值用黄色表示,否则用灰色表示
def highlight_value_above10(value):
    color='yellow' if value >3 else 'grey'
    return 'color:{}'.format(color)

# 通过调用'DataFrame.style.applymap'函数来(作用于表中的每一个数值)美化该表
df.head(10).style.applymap(highlight_value_above10)
得到结果如下:
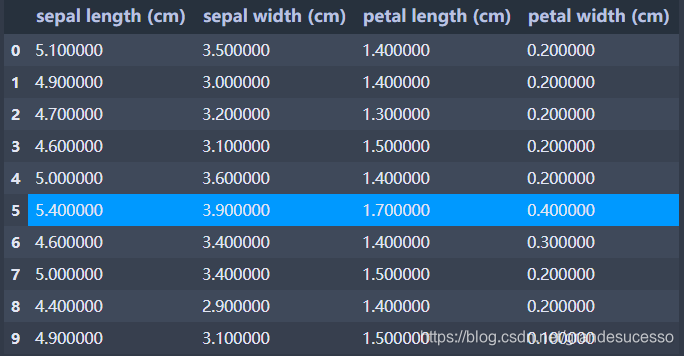
‘DataFrame.style.highlight_max突出显示行/列的最大值
# 突出显示每列的最大值
df.head(10).iloc[:,:-1].style.highlight_max(axis=0,color='#0099FF')
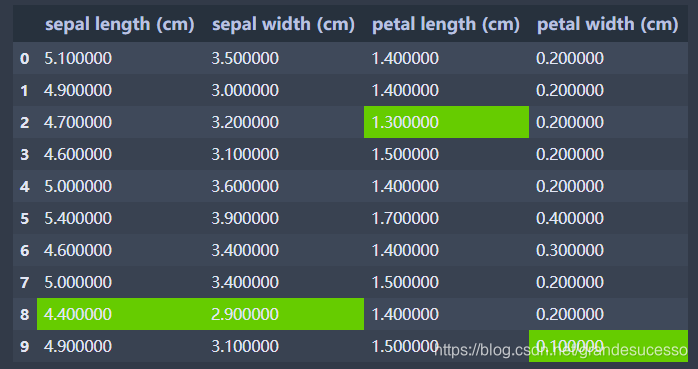
‘DataFrame.style.highlight_min’突出显示行/列的最小值
# 突出显示每列的最小值
df.head(10).iloc[:,:-1].style.highlight_min(axis=0,color='#66CC00')
‘DataFrame.style.highlight_null’突出显示空值
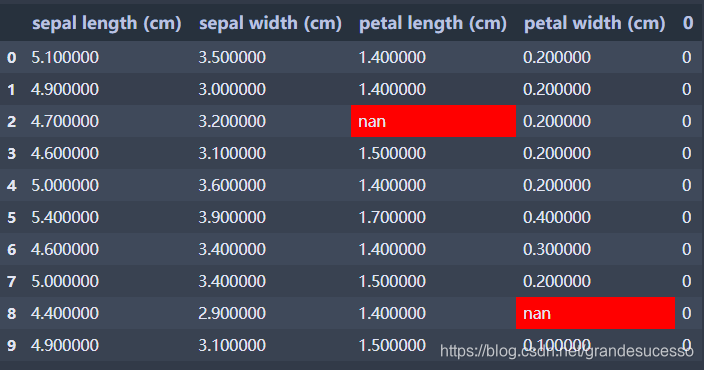
# 在该DataFrame中创建两个空值,用于下面突出显示空值的测试
df.head(10).iloc[2,2]=np.nan
df.head(10).iloc[8,3]=np.nan
df.head(10)


# 使用highlight_null突出显示空值
df.head(10).style.highlight_null()
上面几个函数中参数’color’的值可以是颜色的英文单词,也额可以是颜色的代码(见颜色代码大全)。
版权声明:本文为grandesucesso原创文章,遵循 CC 4.0 BY-SA 版权协议,转载请附上原文出处链接和本声明。